Created interactive data visualization platform for 190+ countries. Implemented real-time data processing with area, scatter, radar, and pictogram charts. Built responsive dashboard with API integration for live data updates. Provided critical insights during pandemic for data-driven decision making.
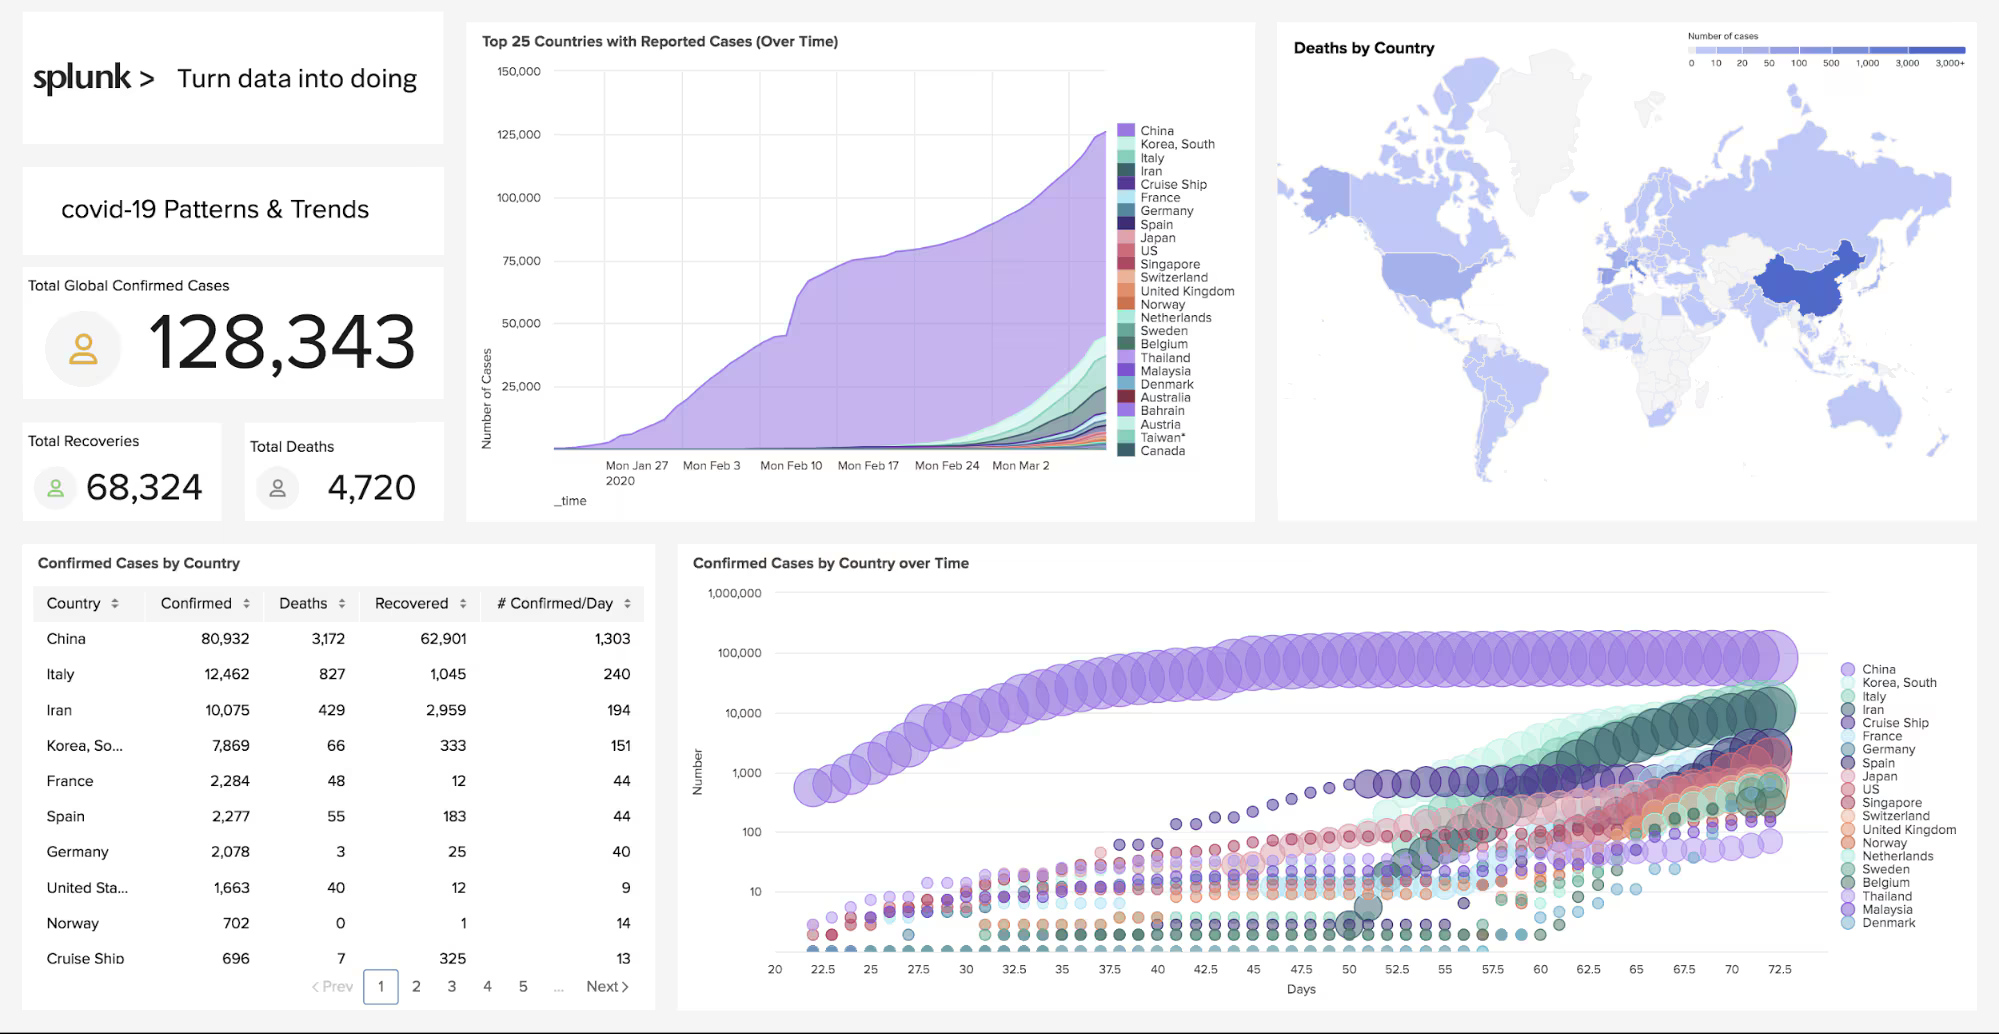
Project Overview
Related Projects
Explore more similar projects in my portfolio
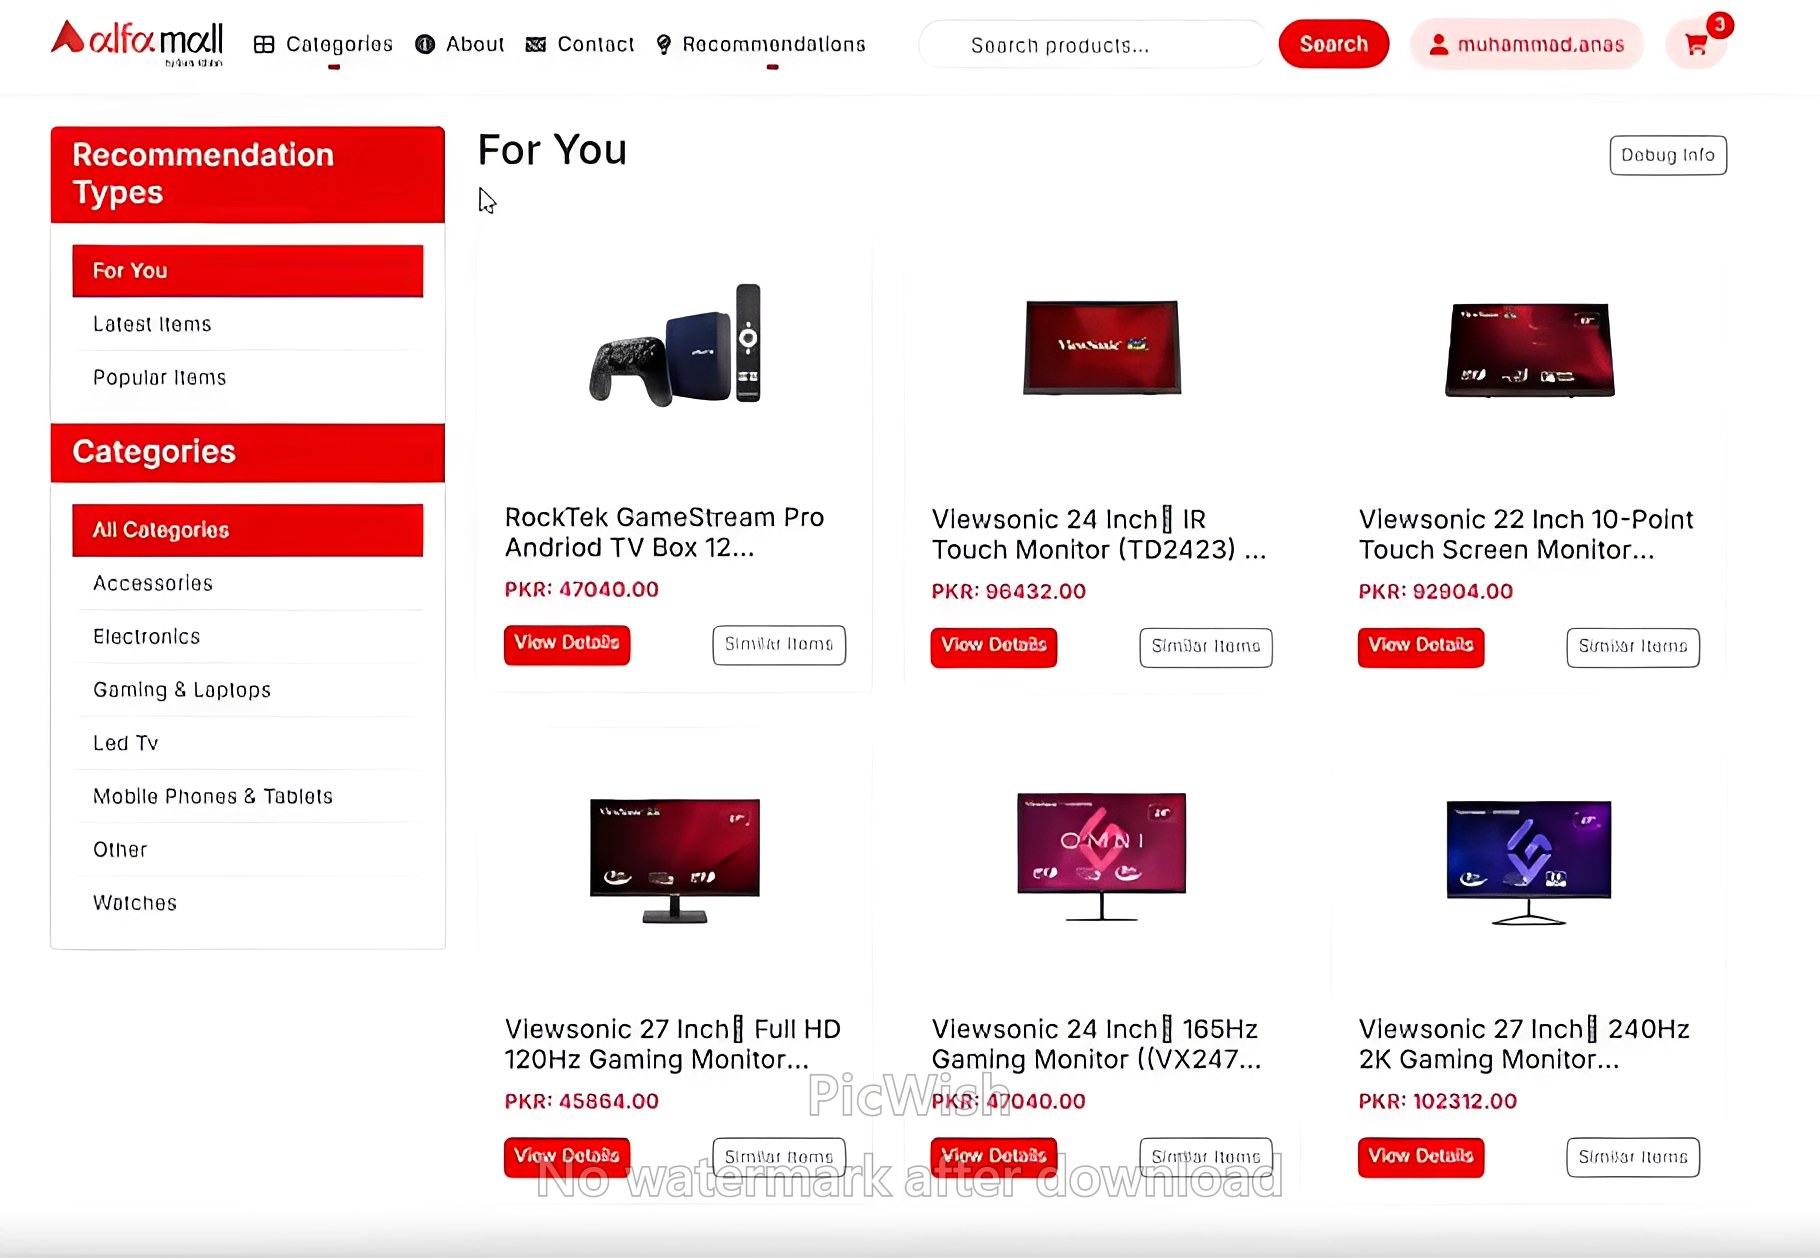
Alfa Mall Recommendation Engine
Real-Time Hybrid Recommendation Engine for Bank Alfalah AlfaMall platform using collaborative, content based filtering and real-time user activity signals

Compliance & Retail RAG-Based Chatbots
RAG-based chatbots for compliance and retail inquiries with OCR and PDF ingestion

Real-Time ATM Anomaly Detection System
Anomaly detection across hundreds of ATMs with optimized vision models for minimal latency
Have a Project in Mind?
Let's collaborate to bring your ideas to life with cutting-edge AI/ML solutions!
×
![]()